I reverse-engineered my Pixel Watch's raw PPG sensor to check myself for sleep apnea
My approach as a curious software engineer without medical experience.
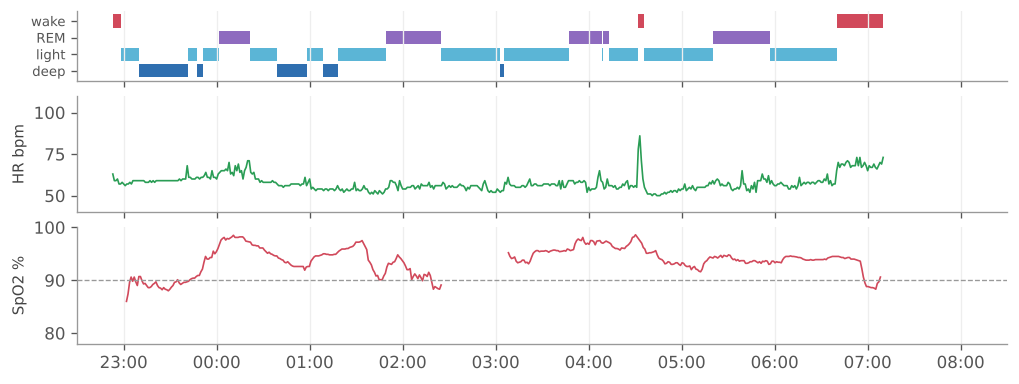
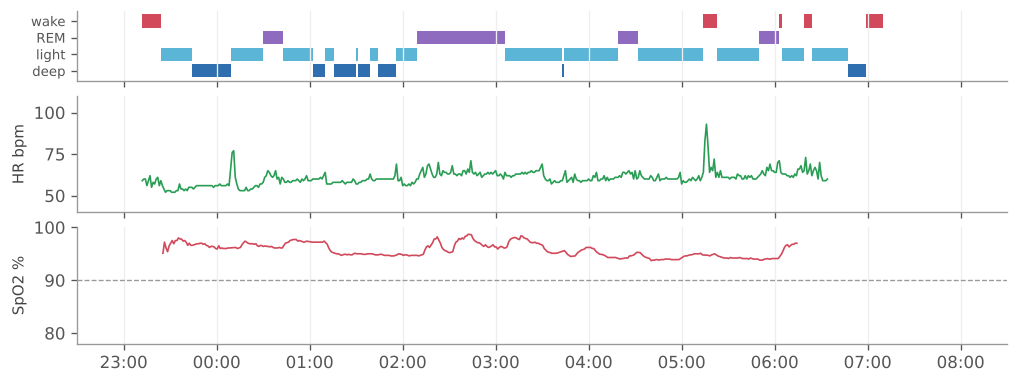
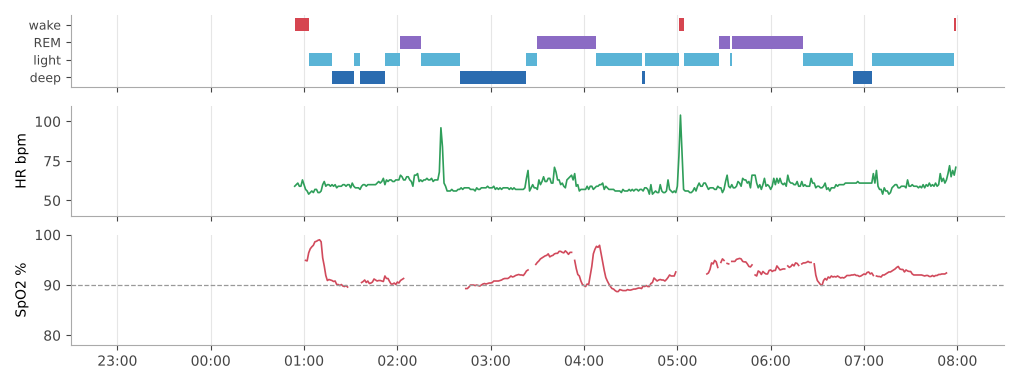
On October 29, my Fitbit Air told me something I didn't expect. For about an hour after I fell asleep, my blood oxygen sat between 80 and 87 %. Then it snapped back to the mid-90s, as if nothing had happened.

Normal is 95 % or more, and below 90 % counts as low. Wrist-based SpO2 is easily fooled, for example by lying on your arm, so one graph proves nothing. But it wasn't the only night like that, and it left me with a question I couldn't shake: do I have sleep apnea?
Ask most people what sleep apnea looks like and you get the same picture: someone overweight, middle-aged, snoring loud enough to wake the whole house. That picture isn't wrong. It's just incomplete.
Obstructive sleep apnea means your airway repeatedly narrows or closes while you sleep. Breathing gets shallow or stops for ten seconds or longer, blood oxygen drops, and your brain briefly wakes you up to get things going again. Usually you don't notice any of it. You just wake up tired.
The Mayo Clinic has a list of warning signs. I went through it as honestly as I could.
At night2 of 4
- Loud snoringI don't snore.no
- Breathing pauses noticed by a partnerAccording to my partner: none.no
- Waking up gasping or chokingMaybe once a quarter, possibly related to the mouth tape I usually sleep with.rarely
- Needing to peeOnce a night, 28 out of 30 nights, but that has been the case since I was a teenager.yes
During the day2 of 6
- Excessive daytime sleepinessTired sometimes, but not excessively.no
- Dry mouth or sore throatI used to be a mouth breather. Since I started taping my mouth, rarely. During my test nights without tape: none.no
- Morning headachessometimes
- Trouble focusingsometimes
- Mood changesNothing that stands out.no
- High blood pressureMine is around 110–115 / 67–72.no
Risk factors1 of 3
- Excess weightI'm in a normal range, and I'm kind of active.no
- SmokingI don't smoke.no
- Alcohol, which relaxes the throat musclesI rarely drink.rarely
So mostly no. The "sometimes" answers are honest, but trouble focusing and the odd headache describe most people with a desk job. Still, two things kept bugging me. A "narrowed airway" is also on Mayo's list of risk factors, and that's about anatomy, not weight: a small jaw or large tonsils can narrow the airway of a perfectly lean person. And no matter how honest I am, I can't watch myself sleep. Which brings me back to that hour on October 29.
So instead of just wondering, I did what software engineers do. The Fitbit Air can't run my own code, and Fitbit only hands out finished numbers. But I still had a Pixel Watch 1 in a drawer, and that one runs Wear OS. So I took it out and wrote an app for it. It logs movement, heart rate and, through a sensor I didn't expect to have access to, the raw optical pulse signal at 100 Hz. Then I wore it for nine nights in a row and checked a handful of questions against that data.
This is not medical advice and not a medical analysis. It's the process of a developer poking at sensor data. If you have symptoms, talk to a doctor and get a real sleep study.
The setup
A foreground service on the watch logs the accelerometer at 25 Hz, the gyroscope, and the regular heart-rate sensor at about 1 Hz, and writes everything to CSV files. In the morning I pull the files off the watch over adb and run an analysis script on them (first in Python, later ported to TypeScript). Getting adb to talk to the watch over Wi-Fi took longer than writing the logger.
The second data source is Fitbit itself. From October 30 on, the Pixel Watch replaced the Air on my wrist, and it runs Fitbit's own sleep tracking in the background, next to my logger, and the Fitbit Web API hands out the results per night: sleep stages, heart rate per minute, breathing rate, HRV in five-minute steps and SpO2 per minute. The kavibay widget from Fig. 1 shows that data and exports it as JSON, which I drop next to my own files. So every night has two versions: what my logger recorded, and what Fitbit made of it.
Fitbit is my only reference, and not a perfect one. Whenever I write that something "matches Fitbit" below, it means I measure the same thing Fitbit measures. It doesn't mean either of us is right.
The questions
I didn't write these down as formal hypotheses before the first night. They grew out of the data, one question leading to the next. In the order I tackled them:
- Can wrist motion alone measure my breathing rate?
- Can motion explain the low SpO2 phases?
- Do heart-rate spikes line up with SpO2 dips?
- Can I get beat-to-beat data, and does my HRV match Fitbit's?
- Does beat-level heart rate show an apnea pattern?
- Can the pulse wave measure my breathing?
- Can the raw sensor channels measure SpO2?
The first three only need motion and the regular heart rate. The rest needed a sensor I didn't know I had.
1. Can wrist motion alone measure my breathing rate?
Idea. When you lie still, your breathing moves your arm a tiny bit. Band-pass filter the motion, pick the dominant axis, and look for the repeating period in two-minute windows of stillness.
Test. Compare the result per sleep stage with Fitbit's breathing rate for the same night.
Result. Mostly within 1 breath per minute of Fitbit, over nine nights, with a median around 15.5 to 16.5 breaths per minute. REM sleep is where the two differ most, by up to about 3 breaths per minute in a single night. The quality filter accepts 86 to 96 % of the still windows. The regular heart rate matched Fitbit almost perfectly too (r = 0.992 to 0.997), but that's expected, since it's the same sensor.
yesWithin about one breath per minute of Fitbit, across nine nights.
2. Can motion explain the low SpO2 phases?
Idea. If a low SpO2 phase is a measurement error, for example because I'm lying on the arm with the watch, the motion data should show it: a wrist that doesn't move, and a value that recovers right after the first movement.
Test. For every phase below 90 % that lasted five minutes or more, check three things: did the arm stay still, did the phase end with a movement, and did heart rate react?

Result. The night of October 30, my first recorded night, had one of those phases. Fitbit only starts reporting SpO2 once it thinks you're asleep, and its very first value, at 23:01, was 86 %. For the next 40 minutes it stayed between 88 and 90 %. In that time, the other two signals did almost nothing:
- My wrist didn't move. The tilt stayed within one degree for 40 minutes.
- Heart rate stayed flat, between 58 and 61 bpm.
At 23:41 I moved for the first time, and my wrist turned by about 20°. Heart rate jumped to 73 bpm for a moment, as it does with every movement. A minute later SpO2 was above 90 %, and it kept climbing. After a second movement at 23:51 it reached 94 %, and over the next two hours it averaged 94 %. I had fallen asleep with that arm around my partner, and she was probably lying on it.
Why does that point to the sensor and not to my breathing? A wrist oximeter needs blood pulsing under the sensor, and pulse oximeters are known to read wrong when blood flow under them is poor. Pressure on the arm does exactly that. Apnea looks different. Each apnea leaves a dent: oxygen drops by three points or more, breathing restarts with a small arousal, heart rate spikes, oxygen recovers. Then the next one, every minute or two, like a sawtooth. Here there is one flat plateau, no heart-rate reaction, and an end that coincides with moving the arm.
Two things keep this at "probably". The recovery wasn't instant. Fitbit's per-minute SpO2 looks heavily smoothed, so a slow climb is what I'd expect from an artifact too, but I can't rule out that something else changed at the same time. And the same night had a second, shorter phase: 02:18 to 02:24 at 88 to 89 %, with no movement and a flat heart rate, and then Fitbit's SpO2 data has a 40-minute gap and comes back at 95 %. That one I can't explain. A third one, from 06:58 to 07:07 at 88 to 89 %, came after my logger had already stopped, at a time Fitbit itself scores as awake. Low readings while I'm awake and breathing normally are another hint that the wrist sensor wanders on its own. Of the next eight nights, only one had another phase below 90 % that lasted five minutes or more. And that one answered the question better than anything I could have planned.
The night of November 7. SpO2 was below 90 % for 40 minutes in total, more than in any night since October 30. This time I looked at the wrist angle minute by minute, and the same wrist position shows up four times in a row:
- 03:54: I turn my wrist into one particular position. Within five minutes SpO2 slides from about 96 to 90 %.
- 04:05: I turn it by about 20°. Three minutes later SpO2 is at 97 to 98 %.
- 04:12: I turn back into exactly the first position. Five minutes later SpO2 is below 90 % again, and it stays at 89 % for 25 minutes.
- 04:43: I turn away again, and it climbs back above 90 %.

During the long low phase, heart rate sat at 56 to 57 bpm, breathing at a steady 15.5 to 16 breaths per minute, and I didn't move at all. Turning my wrist usually means turning my body too, and apnea can be worse in some positions, so this alone isn't proof. But position-dependent apnea would look like the sawtooth from above, with heart-rate spikes. This is a flat plateau with a calm heart and steady breathing that ends within minutes of a 20° turn, twice. A sensor that sits differently on the skin explains that much better. Over the whole night, SpO2 mostly follows the wrist position: from one still stretch to the next, the median jumps between 89 and 98 %, and within a stretch it varies by less than a point. Fitbit's per-minute values are smoothed, so the timing is only accurate to a minute or two. In one case the rise starts a minute before the turn I logged.
mostlyThe long low phases follow the position of my wrist, not my breathing. One short phase on October 30 stays unexplained.
3. Do heart-rate spikes line up with SpO2 dips?
Idea. At the end of an apnea, when you start breathing again, heart rate briefly jumps. Repeated apneas leave a pattern of spikes every 25 to 100 seconds. And if those spikes come from breathing pauses, they should line up with drops in SpO2.
Test. Two parts. First, a detector for that periodic pattern on my own heart-rate data. Second, across the first six nights: every minute where heart rate jumps at least 6 bpm above the previous ten minutes, every SpO2 dip of at least 3 points, and whether the two show up together. I also checked each spike against my motion data, because moving in your sleep raises heart rate too.
Result. The periodic detector found zero or one short episode per night, and one of those was me getting restless before a trip to the bathroom. The spike-and-dip comparison:
| Night | Asleep | HR spikes | with movement | SpO2 dips ≥3 | dips with a spike |
|---|---|---|---|---|---|
| Oct 30 | 459 min | 7 | 6 | 2 | 0 |
| Oct 31 | 470 min | 8 | 6 | 0 | – |
| Nov 1 | 478 min | 6 | 4 | 0 | – |
| Nov 3 | 439 min | 10 | 6 | 0 | – |
| Nov 4 | 367 min | 5 | 2 | 0 | – |
| Nov 5 | 433 min | 13 | 8 | 0 | – |
| Total | 2,646 min | 49 | 32 | 2 | 0 |
I ran this comparison before the last three nights, so they aren't in the table. Two out of three spikes happen within a minute of a movement, while only about one in four minutes has movement at all. So most spikes are me turning over, not me gasping for air. In those six nights there were only two SpO2 dips of 3 points or more, both on October 30, and neither came with a spike. Minute by minute, heart rate and SpO2 don't correlate at any delay from −3 to +3 minutes (|r| ≤ 0.10 in every night).
That's a "no" for my nights, not a "no" for the method. The spike-and-dip comparison runs on per-minute data, so it can't resolve the 25 to 100 second rhythm itself (question 5 goes back to that), and I have no night with real apneas to show the detector works. One idea for a reference failed right away: I put my phone next to the bed to record snoring and pauses, and only about 30 % of the recording was loud enough to analyse.
noMost heart-rate spikes are me moving, and none of the SpO2 dips came with a spike.
And here the boring setup hit its ceiling. A heart rate that updates once per second, already smoothed by Wear OS, can't see a single heartbeat. And SpO2 came from Fitbit as a black box.
Let's have a look at the sensors
Android lists every sensor a device has, including the ones that aren't in any public API. So I asked the watch:
$ adb shell "dumpsys sensorservice | grep -iE 'ppg|beat|heart|ibi'"
HeartRate                 | Google | type: android.sensor.heart_rate(21)
PPG Controller            | Google | type: com.google.sensor.ppg_controller(65549)
PPG Sensor                | TI     | type: com.google.wear.sensor.ppg(65572)
HeartRate-Extended        | Google | type: com.google.sensor.heart_rate_extended(131086)
A raw "PPG Sensor" from TI, and all it needs is the normal BODY_SENSORS permission my app already had. PPG (photoplethysmography) is the green light on the back of the watch: LEDs shine into your skin, and a photodiode measures how much light comes back as blood pulses through.
I wasn't the first to find it. Developers have been asking about this sensor on Wear OS forums for years, and a 2026 study, HEART-Watch, recorded PPG and ECG from a Pixel Watch through the same Android API. They got two channels at about 68 Hz, couldn't tell what each one does, and asked Texas Instruments for a datasheet without success.
I couldn't find any official documentation of what the values mean, so I added a raw logging mode and recorded three minutes at my desk. The sensor delivers 100 samples per second with seven values each. Two of them turned out to be status values. The PPG Controller sensor reports the LED current per channel, which told me which channels are lit and which only measure ambient light. One channel, v6, showed a clean pulse wave.
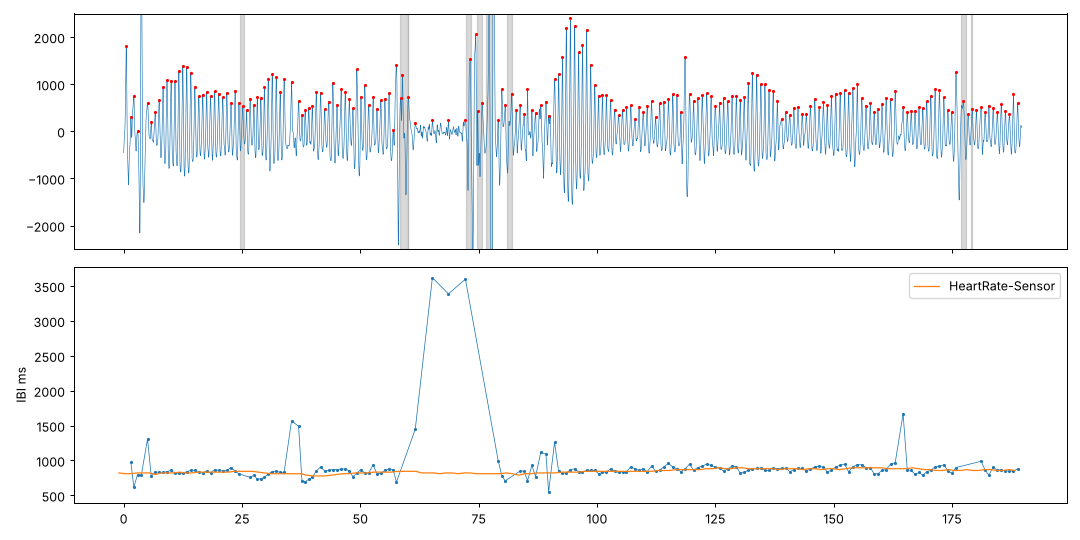
HeartRate-Extended, which I hoped would contain beat intervals, only contains heart rate plus a status flag.
4. Can I get beat-to-beat data, and does my HRV match Fitbit's?
Idea. With a raw pulse wave I can detect every single beat and calculate HRV (heart rate variability) myself, instead of trusting Fitbit's number.
Test. Full nights with raw PPG logging. Compare my five-minute RMSSD with Fitbit's five-minute HRV.

Result. 89 to 92 % of each night was a clean sequence of beats, around 25,000 beats per night. My HRV correlates with Fitbit's at r = 0.94 on three nights in a row, and at 0.97 and 0.88 on the two PPG nights after that. Mine reads 4 to 6 ms higher, but they move together. This was the moment I started trusting the setup.
Strictly speaking, beat intervals from a pulse wave give you pulse rate variability (PRV), not the heart rate variability you'd get from an ECG. The two are related but not interchangeable. Fitbit's overnight HRV comes from the same kind of optical sensor, so r = 0.94 says my pipeline and Fitbit's agree with each other. It doesn't say either of them matches an ECG.
The cost is real. Raw PPG logging drains 12 to 13 % battery per hour and writes about 27 MB per hour. A full charge barely lasts a night.
yesEvery single beat, and an HRV that moves with Fitbit's (r = 0.88 to 0.97).
5. Does beat-level heart rate show an apnea pattern?
Idea. With every single beat, the 25 to 100 second rhythm from question 3 is no longer hidden in per-minute averages. If there are repeated breathing pauses, I should see it here.
Test. Three PPG nights. Heart rate from every clean beat, smoothed over five seconds. A spike is a rise of at least 6 bpm above the three-minute median, at least 15 seconds after the previous one, with no movement within 15 seconds. An episode is a chain of at least four spikes, each 25 to 100 seconds apart. To see what chance alone produces, I put the same number of spikes at random times 200 times and counted the episodes again.
My first run found 11 to 18 "episodes" per night. That looked alarming for about ten minutes. It was my own irregular beats: a beat that comes early looks like a sudden jump in heart rate. The ordinary speeding up and slowing down with every breath added the rest. After removing irregular beats and their neighbours and smoothing over five seconds, the picture changed completely.
| Night | Clean, still | Spikes ≥6 bpm | per hour | Episodes | by chance (95 %) | Spikes ≥10 bpm |
|---|---|---|---|---|---|---|
| Nov 3 | 6.6 h | 75 | 11.3 | 1 | ≤ 1 | 19 |
| Nov 4 | 6.2 h | 83 | 13.5 | 2 | ≤ 2 | 23 |
| Nov 5 | 6.9 h | 74 | 10.8 | 1 | ≤ 1 | 15 |
Result. One or two episodes per night, each exactly four spikes long, which is what random spikes produce anyway. With a 10 bpm threshold there are no episodes at all. So even at full resolution there's no apnea rhythm in my heart rate. The same caveat as before applies: without a night with real apneas I can't show that the detector would catch one. And spikes at random times are only a sanity check. Real spikes cluster around movement, sleep stages and brief awakenings, which a random baseline doesn't reproduce.
noEven beat by beat, there's no more rhythm than chance produces.
6. Can the pulse wave measure my breathing?
Idea. Breathing changes the pulse wave in two ways. Heart rate rises when you breathe in and falls when you breathe out, and the height of each pulse goes up and down with the pressure in your chest. Both should give a breathing rate that has nothing to do with wrist motion. And if breathing stops, the modulation might stop with it. That only works if the effort stops too, as in central apnea. In the obstructive kind, the chest keeps pulling against a closed airway, so the modulation can continue or even grow while no air moves at all (that continued effort is how obstructive apneas are defined).
Test. For every 60-second window of clean, still beats, estimate the breathing rate from pulse height and from beat intervals, keep the windows where both agree, and compare them with the motion-based rate from question 1.

Result. Two signals from different sensors, and they mostly agree: 60 to 70 % of the windows are within 1 breath per minute of the motion estimate, with a median difference of about 0.5. The pulse wave reads slightly lower overall, and in the first hour of November 4 the two clearly disagree. I don't know yet which one is wrong there.
Pauses: in about 20 hours of clean, still data I found no stretch of ten seconds or more where the breathing modulation disappeared. At best that speaks against long central pauses in those hours. It says little about obstructive ones, where the modulation would keep going. I also couldn't validate the detector: during the breath holds from question 7 the watch flagged my body as moving and threw away most of the beats. (A voluntary breath hold mimics a central pause anyway, not an obstructive one.) What the holds did show: my heart rate fell during each hold, from the mid-70s to about 63 bpm at the end, the classic diving reflex (Fig. 10).
partlyThe rate mostly agrees with the motion estimate. Whether it would catch a pause is untested, and an obstructive one it might not see at all.
7. Can the raw sensor channels measure SpO2?
Idea. A pulse oximeter compares how strongly blood pulses in red light and in infrared light, because oxygenated and deoxygenated blood absorb them differently. The ratio goes into a formula, the textbook approximation being SpO2 ≈ 110 − 25 × R, which every device then calibrates for its own hardware. Based on the LED currents, I guessed that v4 was red and v1 infrared.
Test 1: nights. Correlate my uncalibrated estimate with Fitbit's SpO2. Night 5 gave r = 0.64, and I was excited. Night 6 gave 0.27, night 7 gave 0.21, and the two nights after that gave 0.73 and 0.19. Worse, the green channel, which has nothing to do with oxygen, correlated with Fitbit's SpO2 more strongly than my estimate did. Over a night, blood flow in the wrist slowly changes, and Fitbit's SpO2 slowly drifts. Two slow trends will always correlate a bit. My "SpO2" was most likely measuring perfusion.
Test 2: breath holds. Night data can't settle this, because my SpO2 barely changes at night. So I made it change. I put a finger oximeter on the same hand as the watch, filmed its display, and did two rounds of Wim Hof breathing with long breath holds, sitting on the couch. (Please don't copy this. Fast breathing before a breath hold can make you pass out without warning, even on land, and in water it can be fatal. Even the Wim Hof FAQ warns about fainting. If you try the SpO2 test from the repo, use calm, short holds and stop when you feel dizzy.) The oximeter dropped to about 85 % and then to 79 %.
v3/v1 stays at about 1.0. Full chart with all channels and motion.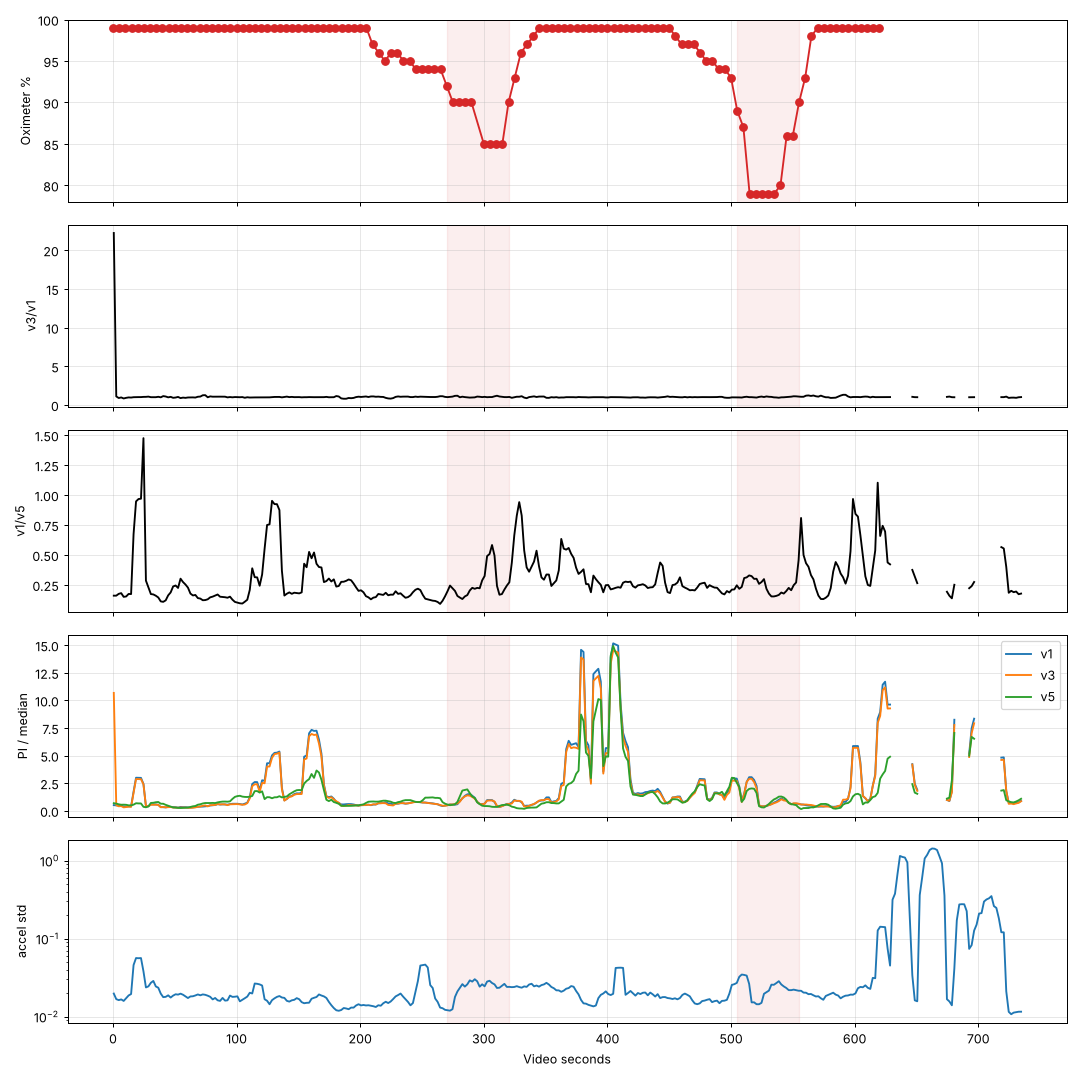
Result. The ratio didn't move. At 99 % and at 79 %, v3/v1 stayed at 1.00. Then I found out why. During the test the watch was running the sensor in a six-channel mode, and my candidate channel v4 only appears in a seven-channel mode. At night the watch switches to that mode on its own, usually 12 to 17 minutes after I start recording.
So in six-channel mode, the one channel ratio I could test showed no oxygen signal at all. I haven't found a way to force the seven-channel mode.
Test 3: breath holds in seven-channel mode. The next afternoon, the watch happened to switch to seven channels on its own and stayed there. I grabbed the oximeter and did two more breath holds, again filming its display next to a clock on my screen. Same formula, same channels, no calibration.
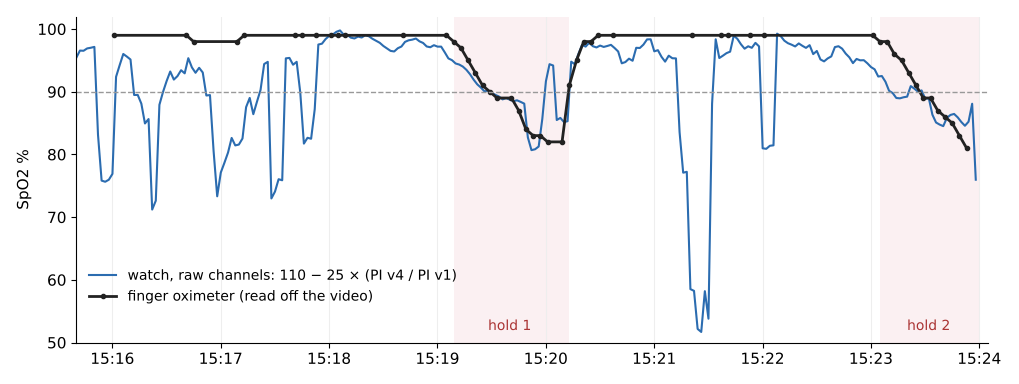
Result. During the holds, the estimate follows the oximeter down from 99 to 82 and 81 % (r = 0.86 and 0.91). The uncalibrated textbook formula puts the lowest points at 81 and 85 %, and during the holds it's off by 2 to 3 points on average. So v4 looks like the red LED and v1 like infrared, though that's inferred from two holds, not from any documentation.
Outside the holds, it falls apart. The oximeter sits at 99 %, and the estimate drops to 75 %, once even to about 52 %. All of those drops fall into the rounds of fast, deep breathing I did before each hold, and each one comes with a sudden jump in pulse amplitude on both channels. Deep breathing pushes blood back and forth in the arm, and a simple ratio can't tell that apart from oxygen. In the calm minutes in between, the estimate stays within about two points of the oximeter.
So the hardware does see oxygen, and a deep drop shows up clearly. Whether that's enough for the nights is still open. My SpO2 at night only moves between 93 and 97 %, so a few points of noise drown it, and Fitbit, my only night reference, is itself an estimate. A usable night value would need artifact rejection and a real calibration against more than two breath holds.
partlyThe channels see a deep drop during a breath hold, but they aren't precise enough yet for the few points SpO2 moves at night.
By the way: there's an ECG in there too
This doesn't help with the apnea question, but I can't leave it out. The Pixel Watch's ECG sensor, the one you use by touching the crown with your other hand, also streams to my own app. The first reading said 152 bpm. That's either a medical emergency or a bug. It was a bug: I was reading channel v2, which is noise, instead of v0, which is the actual signal. And the first eight seconds or so after you touch the crown have to be skipped while the signal settles.
My favourite failure of the whole project: 152 bpm looked completely plausible as a number, it was off by more than a factor of two, and nothing in the output told me so.
Open questions
- Mouth tape. I usually sleep with it. All the nights in this post were without, so I can't say whether it changes anything.
- Sleep position. Apneas are often worse on your back. The logger now classifies sleep position from the wrist, but I haven't evaluated it yet.
- SpO2 at night. In seven-channel mode the raw channels follow a deep drop during a breath hold, but in my nights they only weakly matched Fitbit. Is that noise, or Fitbit?
- Pause detection from the pulse wave. A breath hold only mimics a central pause. In an obstructive one the modulation keeps going, so the pulse wave alone may never see it.
What I know now, and what I don't
What a homemade logger on a 2022 smartwatch can do, according to my nights:
- Heart rate, breathing rate and movement, in close agreement with Fitbit.
- Beat-to-beat data from the raw PPG sensor, with pulse rate variability that tracks Fitbit's HRV at r = 0.88 to 0.97 over five nights.
- Tell movement-driven heart-rate spikes from the rest. In my nights there's no spike pattern, not per minute and not beat by beat, and no link between spikes and SpO2.
- Measure breathing rate from two independent sensors, wrist motion and pulse wave, which mostly agree.
- Show that the long low SpO2 phases in my nights follow the position of my wrist, which points to the sensor, not my breathing.
What it can't do:
- Measure SpO2 reliably. The raw channels follow a deep drop during a breath hold, but nothing shows yet that they are precise enough for the few points SpO2 moves at night.
- Measure airflow or breathing effort, which is what a real sleep study records.
- Rule out milder forms of sleep-disordered breathing, like upper airway resistance syndrome, where breathing gets harder without a big drop in oxygen.
So, do I have sleep apnea? Probably not, but that's mostly my symptom list talking. My nights show no recurring pattern of SpO2 dips or heart-rate spikes, not per minute and not beat by beat, and the long low SpO2 phases look like the sensor, not my breathing. The watch can't rule anything out, though. None of my detectors has ever seen a real apnea, so I don't know what they would miss, and breathing events that end in a brief awakening without a big oxygen drop count too but wouldn't show up in this data at all. The weak spot of this whole project is a different one: everything here is checked against Fitbit, which is itself an estimate from the same wrist.
If you have symptoms, skip the watch and talk to a doctor. If you're just curious what's inside your watch, dumpsys sensorservice is a good place to start.
Try it yourself
The app and all the tools are on GitHub: aswetlow/sleeptracker. You need a Wear OS watch, a PC on the same Wi-Fi, Android Studio and Node.js. The short version:
- Turn on developer mode and wireless debugging on the watch, and install the app from Android Studio.
- In bed, tap Start, or Start + PPG on a Pixel Watch with a full battery. In the morning, Stop.
- Run
npm run syncon the PC. The watch sends the night over Wi-Fi. - Run
npm run analyzeon the session, andnpm run uifor the live view.
The README has the details, and the manual describes every experiment from this post step by step: breath holds, ECG, SpO2 calibration, sleep position. The raw PPG and ECG parts are only tested on a Pixel Watch 1. On other watches you get motion and heart rate. And please treat it the way I did: as a way to look at your own data, not as a diagnosis.
How this was made
I did this together with Claude (Opus 5.5, medium effort), and I'm not hiding that. Claude wrote most of the code for the watch app and the analysis scripts, ran the analyses, and drafted large parts of this text. I decided what to test, wore the watch, did the breath holds, answered the symptom checklist honestly, and pushed back when a conclusion went further than the data. Every number in this post comes from my own recordings and my Fitbit export.
Thanks for reading.
Sources
- Mayo Clinic: Obstructive sleep apnea – Symptoms and causes (symptoms and risk factors)
- Mayo Clinic: Sleep apnea – Symptoms and causes (alcohol and smoking as risk factors)
- Berry et al., AASM: Rules for Scoring Respiratory Events in Sleep, J Clin Sleep Med 2012 (obstructive vs. central apnea, hypopnea)
- Malhotra et al., AASM: Polysomnography for Obstructive Sleep Apnea Should Include Arousal-Based Scoring, J Clin Sleep Med 2018 (events without a big oxygen drop)
- Kapur et al., AASM: Clinical Practice Guideline for Diagnostic Testing for Adult Obstructive Sleep Apnea, J Clin Sleep Med 2017 (how sleep apnea is actually diagnosed)
- Kantrowitz et al.: Pulse rate variability is not the same as heart rate variability, Front Physiol 2025 (PRV vs. HRV)
- Kaetheeswaran et al.: HEART-Watch: A multimodal physiological dataset from a Google Pixel Watch across different physical states, PLOS Digital Health 2026 (raw PPG and ECG from a Pixel Watch, unknown channel meanings)
- FDA: Pulse Oximeters (what affects the accuracy of a reading)
- Wim Hof Method: FAQ (fainting risk of the breathing exercise)
Appendix: every night
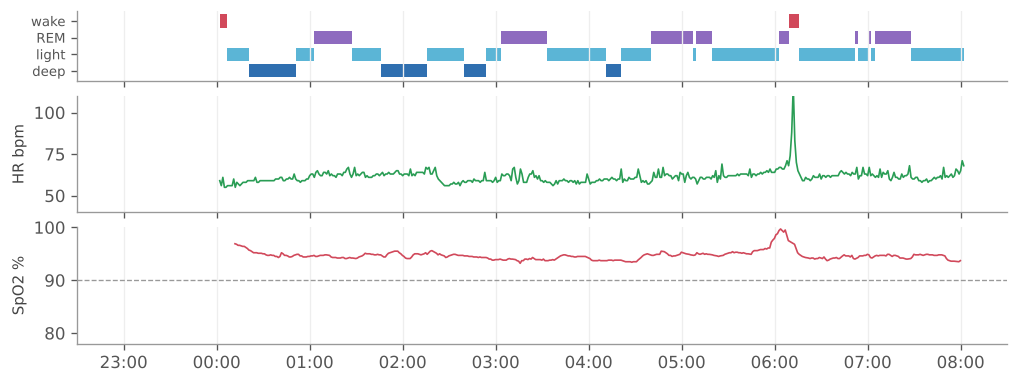
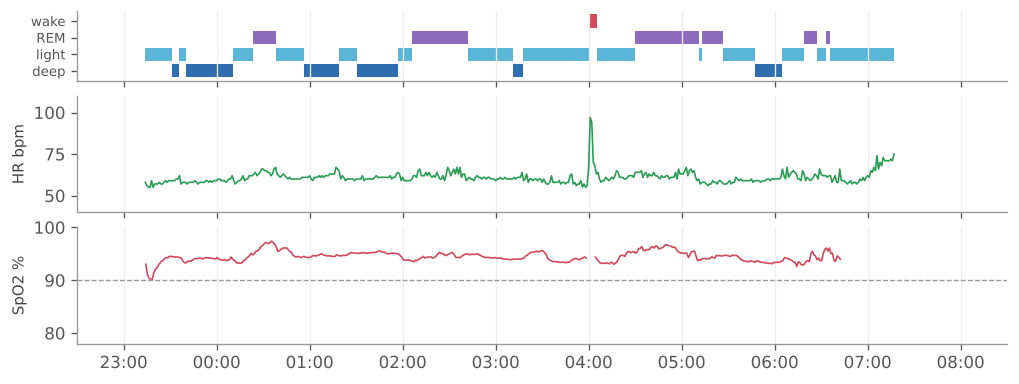
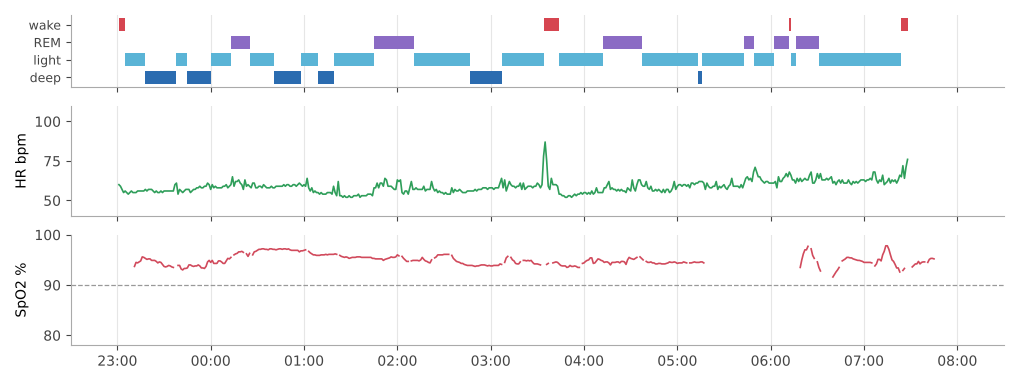
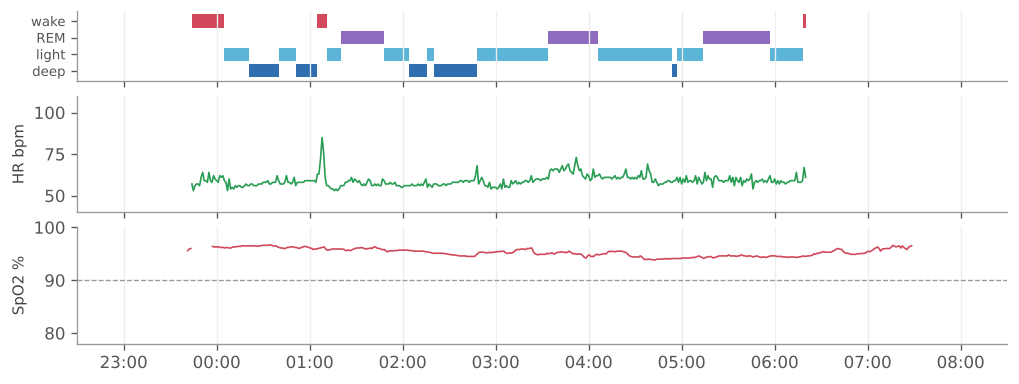
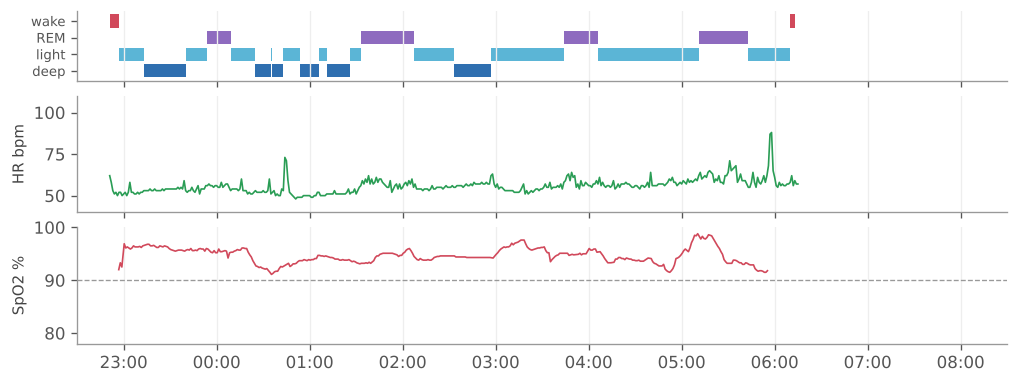
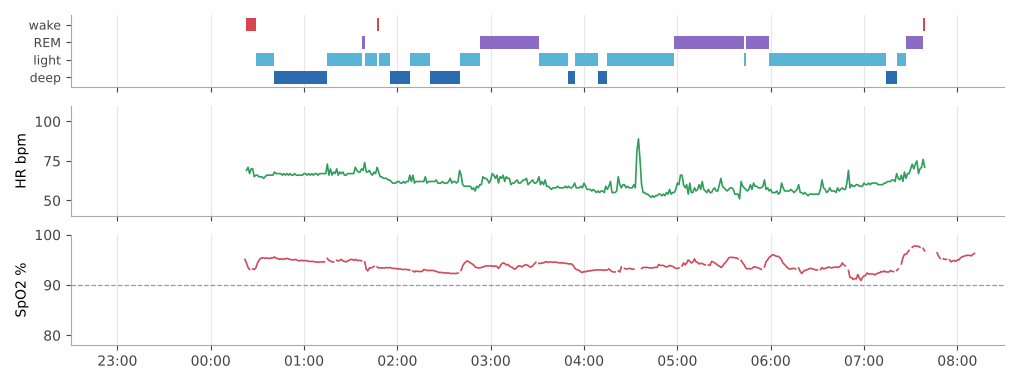
For reference, all nine nights, on the same axes: Fitbit's sleep stages, heart rate per minute and SpO2 per minute. The dashed line is 90 %. October 29 (Fig. 1) was recorded with the Fitbit Air, before my logger existed.